The advanced market forecast indicator simplifies the powerful MFI ThinkorSwim indicator by automatically identifying complex signals.
Your scripts have helped many of us simplify our daily process and provide quicker more accurate signals.

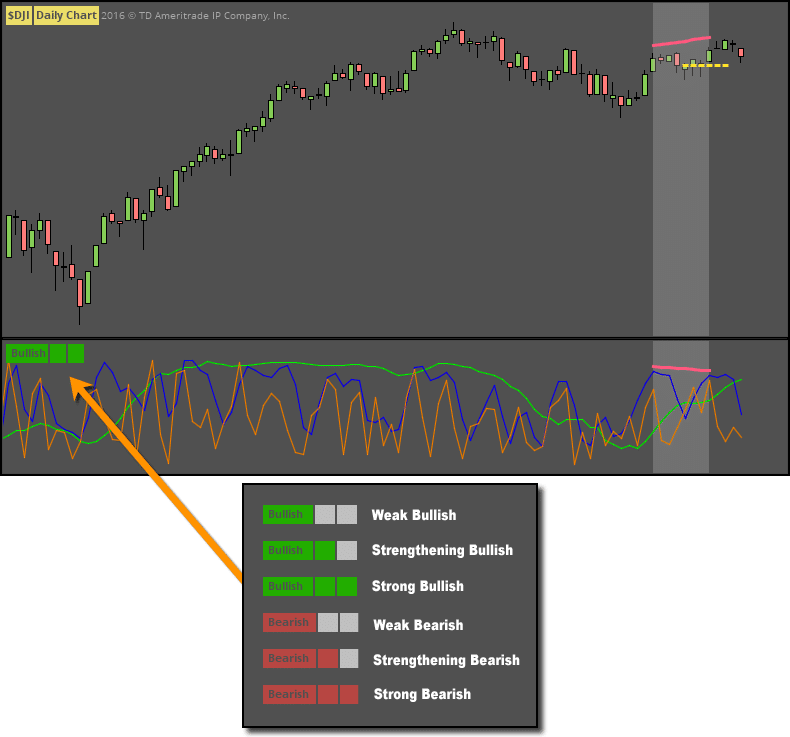
Advanced Market Forecast Indicator
Making a powerful, but complicated, indicator simple to use
Hi
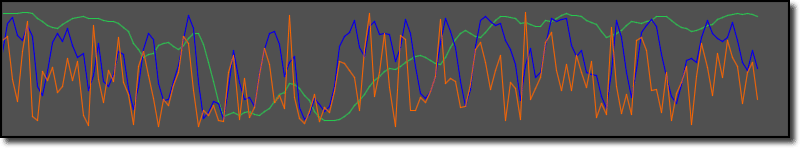
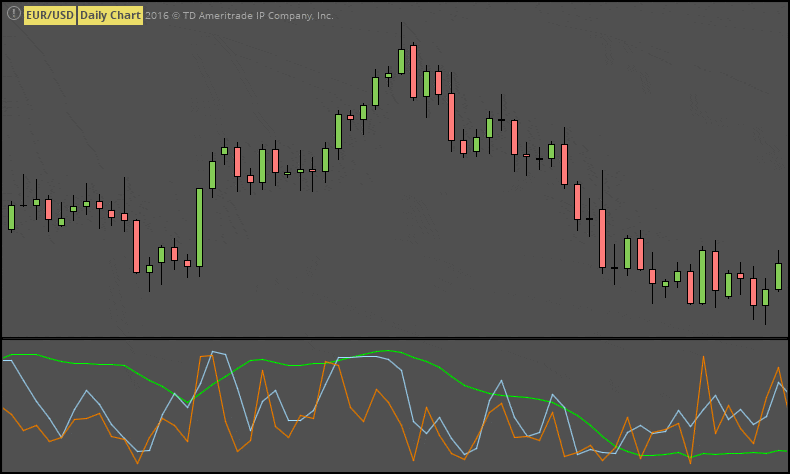
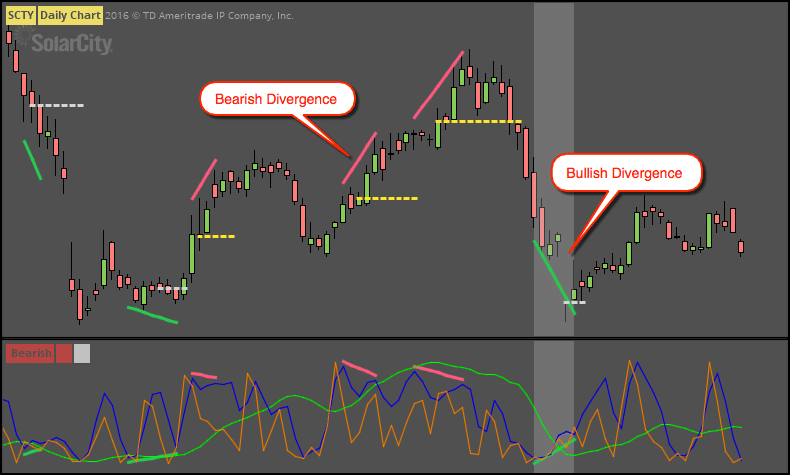
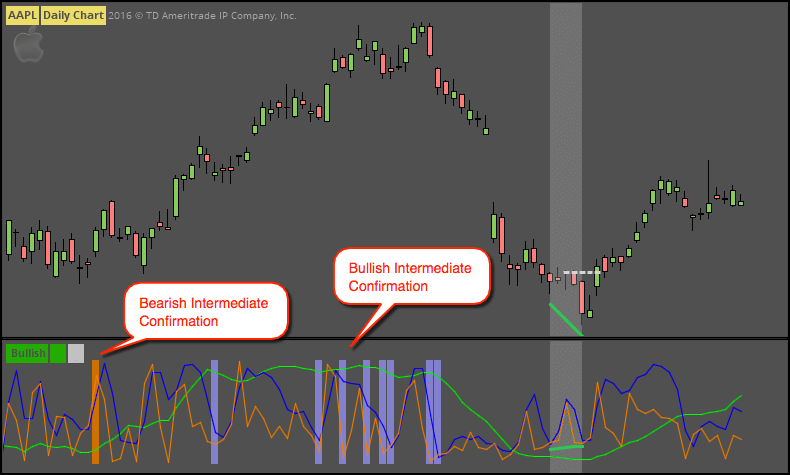
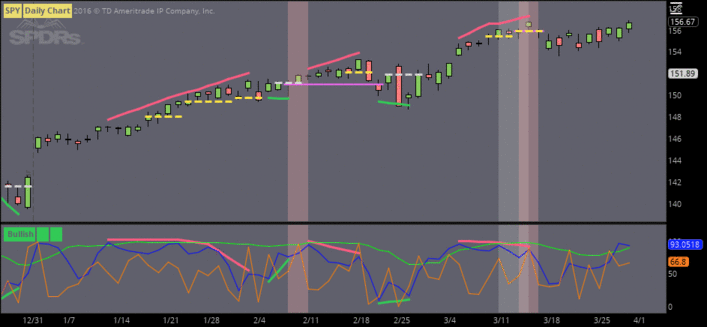
in my online classes at investools some trend trade coaches use the Market Forecast indicator to help identify strength or weakness in trends. It has 3 lines that oscillate between 0 and 100. the 3 lines indicate 3 separate time frames: intermediate line = 1–3 months, near-term line = 5–15 days, and momentum line = 1–5 days and tend to indicate oversold or overbought levels.
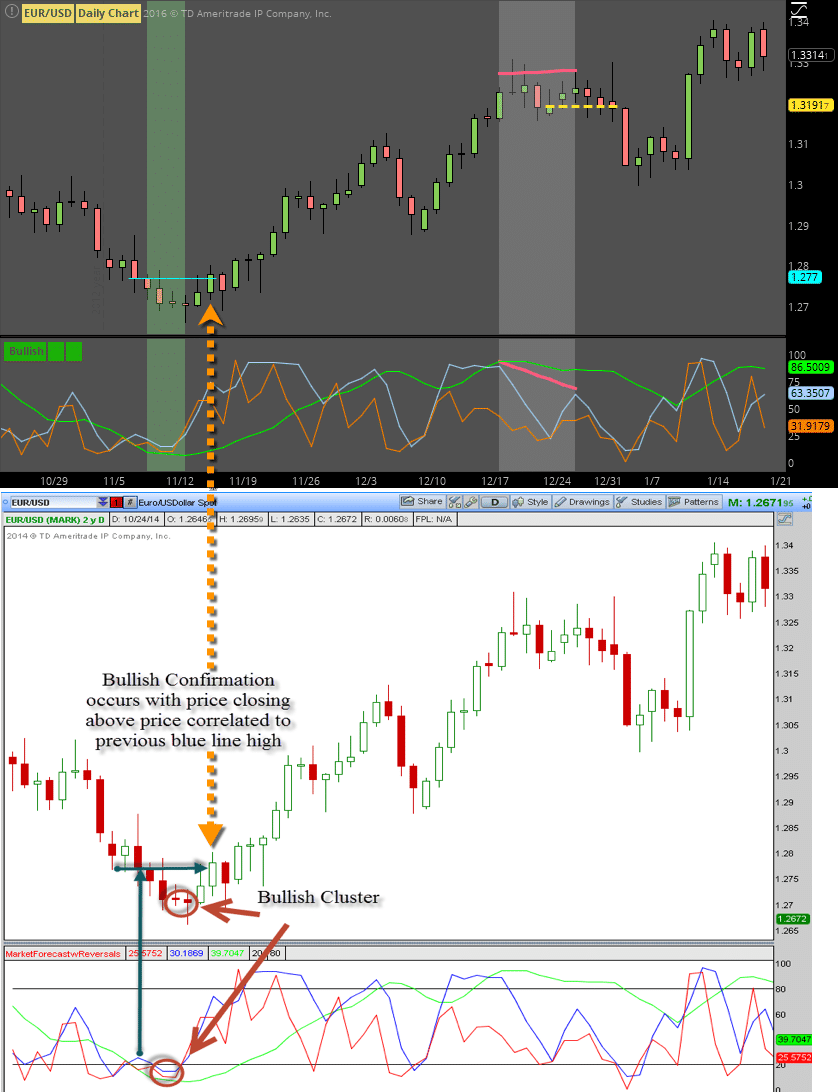
there is a signal people use with it called the near-term divergence which works similar to the macd divergence. the concept is price and the near-term line (shown as blue line below) are diverging or converging. they read it by peaks (or valleys) on the near-term line as it matches up with price action, just like a macd. when a divergence or convergence forms, the idea is to walk backwards on the blue line to find the valley between the peaks (or peak between the valleys) and line that day up with price action. you draw a line from that price day close (shown below in cyan) and you watch to see if price breaks that line, if it does its a warning signal that price may continue to fall further to next support level below (or rise to next resistance level above). this creates the bullish or bearish near-term divergence signal.
i’ve reached out to other coders to ask if they could come up with a thinkscript for this signal, and they said it would be too difficult as it would involve counting backwards on the blue line an undetermined amount of days to search for the previous peak (or previous valley).
would you consider creating a script for me that could identify this signal? or is it really impossible or just too difficult like they said?
Was this difficult? Yes. Was it impossible? No.