Description
Harmonic Patterns
Now available, for the first time, on ThinkorSwim
Harmonic Trading
Harmonic Trading utilizes the best strategies of Fibonacci and pattern recognition techniques to identify, execute, and manage trade opportunities. These techniques are extremely precise and comprise a system that requires specific conditions to be met before any trade is executed. The Harmonic Trading approach offers information regarding the potential state of future price action like no other technical methods.
Numerous resources are available online for learning how to trade harmonic patterns. I recommend starting with these two:
- Trading the Gartley Pattern
- Trading Harmonic Price Patterns
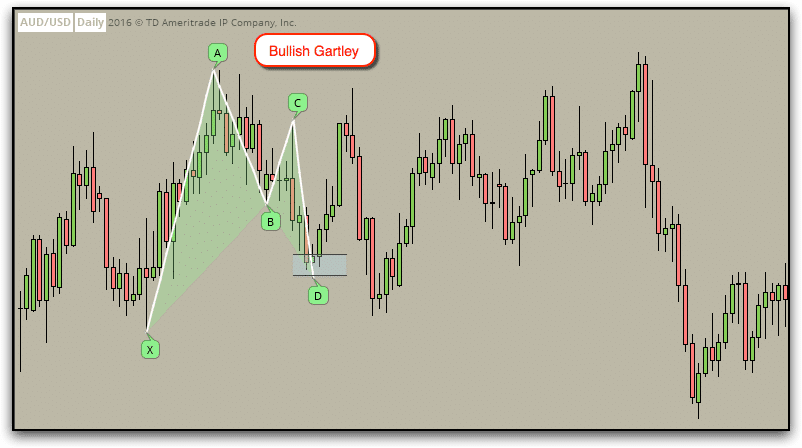
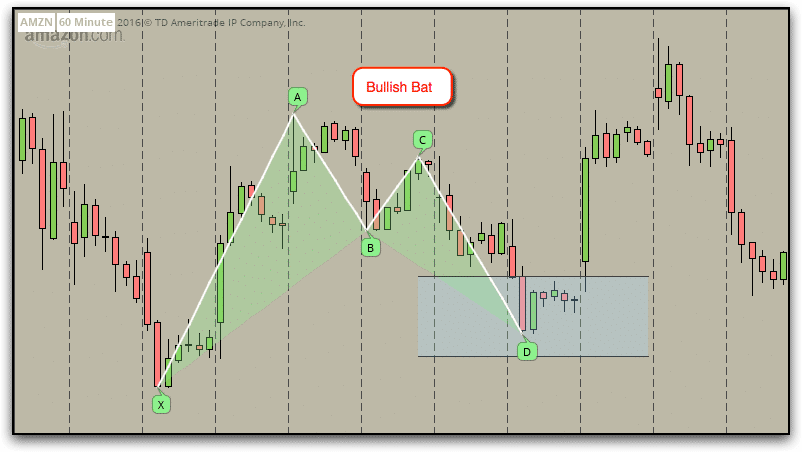
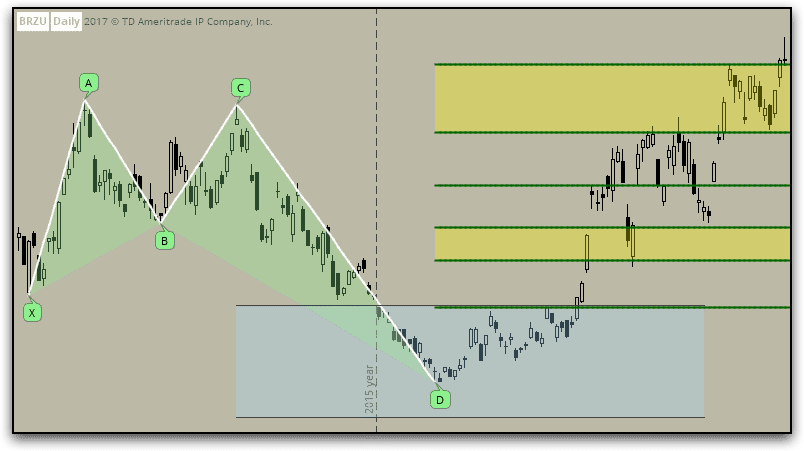
The Potential Reversal Zone
This area is marked as a highly probable area for a reversal. This potential reversal zone is marked once point “C” is identified. By calculating the various Fibonacci aspects of a specific price structure, harmonic patterns can indicate a specific area to examine for potential turning points in price action.
These are zero-lag indicators that rely on price action alone. As such, points “C” and “D” will redraw until the associated peak or valley has fully formed.
These indicators will work on any chart time frame and with any instrument (stocks, futures, currency pairs, etc.) A few more examples are shown below.
These indicators do not include entry or exit signals. The trader is responsible for deciding when to enter and exit a position.
Neither do these include scans. These patterns are simply too complex for the scan tool.
Since there is no scanner, the patterns are identified on the charts early to allow the trader time to monitor for the potential reversal. They start drawing once point “C” has been verified.
Within the script settings panel, the user may adjust the “wave length” of the pattern. The wave length determines the number of bars between successive peaks or valleys. A larger wave length corresponds to larger swings in price (typically). Additionally, colors may be adjusted within the “Globals” tab.
Major Update to Harmonic Patterns
Today I completed a major update to the harmonic pattern indicators. This is a FREE upgrade for anyone who has already purchased these indicators. Simply re-visit the link that was sent to you after purchase and re-download the newest version.
Firstly, I have improved the algorithm so that the patterns are more accurate.
Secondly, I have implemented a method of removing patterns that didn’t fully form. It is important to realize that since there is no method of scanning for these patters since they are too complex for the scan tool, I have chosen to start drawing the patterns when they are only about 80% completed. This feature is intended to give the trader time to prepare for a possible reversal at, or near, point D.
In the settings panel, I have included a Fudge Factor variable that is initially set at 0.8. This means that candle at point D must be no more than (0.8)*(Average True Range) away from the potential reversal zone. If it falls outside of that range, then the chart pattern will be removed. The user may choose to set that “fudge factor” higher if desired.
Thirdly, I have added a new feature to plot target areas as described in this Stock Charts article about trading harmonic patterns. This feature may be enabled by setting Show Target Zones to “yes” within the chart settings panel.


The harmonic patterns available include bullish and bearish versions of:
- Gartley “222”
- Bat
- Butterfly
- Crab